F1 Race Retirement Betting: Reliability Data, DNF Rates and Market Angles
 Available in US
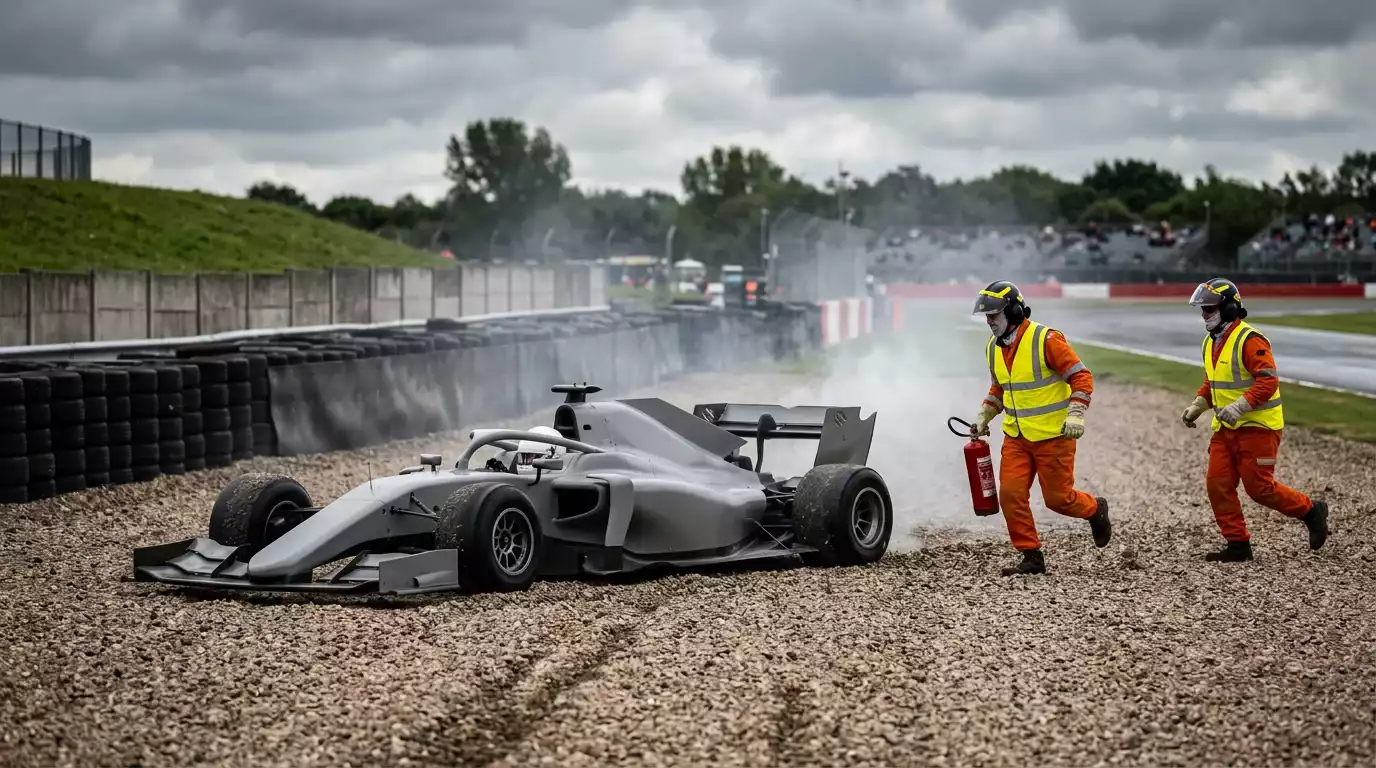
I once watched a comfortable podium bet evaporate on lap 48 of 56 when a hydraulic failure retired my driver from third place. That loss stung more than any bad prediction because it had nothing to do with my analysis – the pace read was correct, the strategy call was right, and pure mechanical chance wiped out the position. That experience pushed me to treat retirement probability not as background noise but as an active betting variable, and eventually to start betting on retirements directly.
How F1 Retirement Markets Work
Retirement markets come in several forms. The most common is “first driver to retire,” which pays out on whichever driver is the first classified DNF (Did Not Finish) in a race. Some bookmakers offer “total retirements” over/under lines, typically set at 2.5 or 3.5 for a 20-car grid. Rarer but more interesting are driver-specific retirement props – “will driver X finish the race?” – priced as a yes/no market with odds reflecting that driver’s or team’s reliability record.
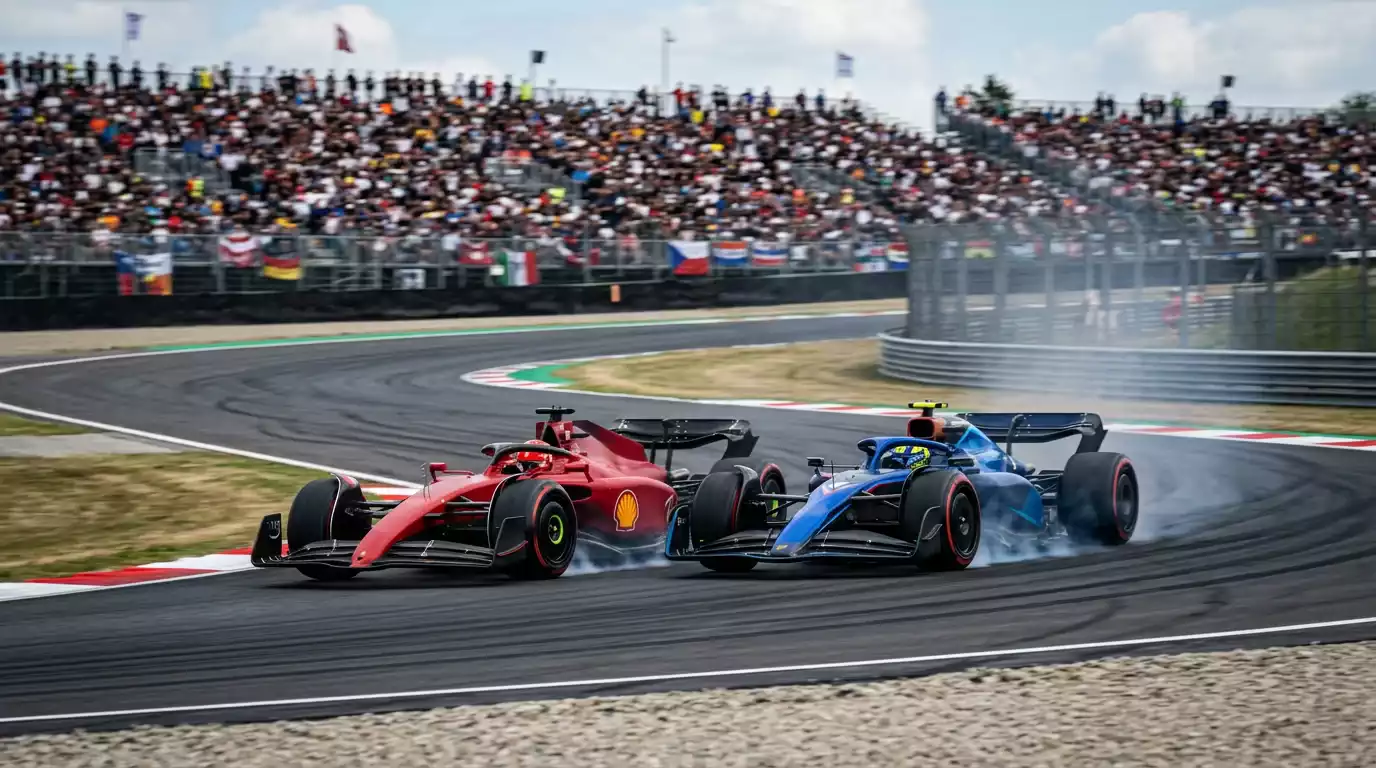
First-retirement markets attract the most volume because they add an element of race-watching excitement that standard markets do not. You are effectively betting on misfortune, and the chaotic opening laps of any grand prix provide instant settlement for a significant portion of first-retirement bets. Contact incidents in the first chicane at Monza, the uphill run to Turn 1 at Spa, and the narrow entry at Singapore’s Turn 1 produce first-lap retirements with enough regularity that circuit-specific pricing should differ meaningfully from flat-rate average pricing.
Emily Prazer, F1’s Chief Commercial Officer, described the sport’s commitment to delivering new fan engagement opportunities when announcing ALT Sports Data as the official betting data supplier. Retirement markets are a natural extension of that vision because they connect directly to the race narrative – every retirement reshuffles the order and creates a talking point, making the market inherently engaging for the growing fanbase that F1’s 827 million global audience now represents.
Reliability Data Sources and What They Reveal
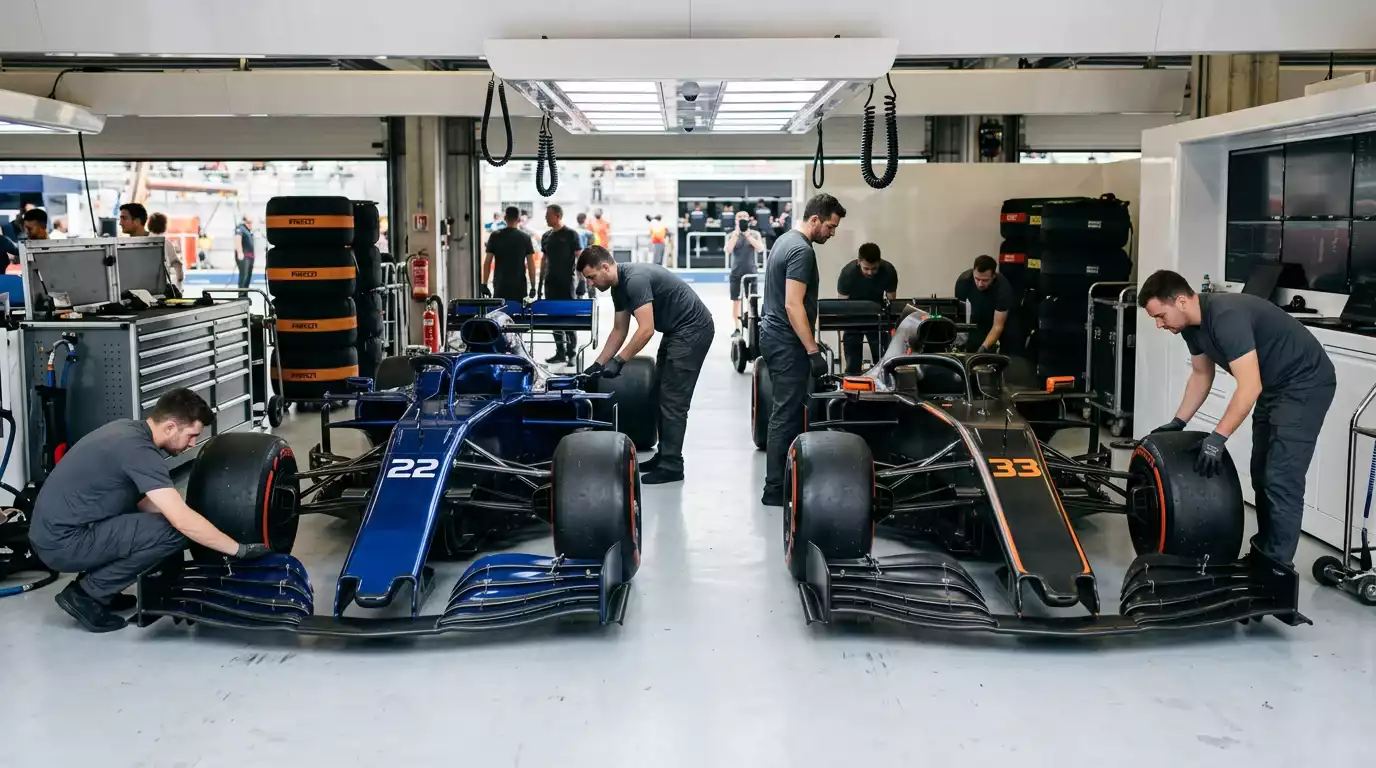
Tracking mechanical reliability requires separating different retirement types. Mechanical failures – engine, gearbox, hydraulics, electrical – are functionally random within a season but correlate with power unit age and mileage. Incident-related retirements – first-lap contact, racing incidents, driver errors – correlate with grid position, circuit type, and driver aggression profile. Treating both as identical “DNFs” in your model produces garbage outputs because their causes and predictors are entirely different.
Power unit component tracking is publicly available through FIA documentation. Each driver is allocated a fixed number of engine, turbocharger, MGU-H, MGU-K, energy store, and control electronics components per season. When a driver exceeds their allocation, they take grid penalties, but in the races leading up to that penalty point, the team runs their oldest components at higher risk of failure. A driver on their third engine in race eighteen of twenty-four is running a high-mileage unit, and the mechanical retirement probability increases measurably.
I maintain a component mileage tracker for the top ten teams. When a driver’s primary engine passes 5,000 kilometres of race mileage – roughly four to five race weekends of total running – their mechanical retirement probability rises by approximately 2-3 percentage points per subsequent race, based on five seasons of tracking. That increase is small per race but compounds when betting over/under total retirements or pricing first-retirement markets where multiple high-mileage units are in play simultaneously.
Circuit-Specific Retirement Patterns
Not every circuit punishes cars equally. High-speed tracks with heavy braking zones – Monza, Jeddah, Baku, stress braking systems and power units more aggressively than flowing circuits like Suzuka or Silverstone. Street circuits impose additional stress through kerb strikes and close-wall running that can damage suspension components and floor edges, leading to delayed failures that manifest as mid-race retirements rather than immediate breakdowns.
The data over the last five seasons shows a clear split. Street circuits average 2.4 retirements per race. Permanent circuits average 1.7. High-altitude races like Mexico City, where the thin air stresses cooling systems and turbochargers, average 2.1. These numbers are stable enough year-over-year that they serve as reliable baselines for over/under total retirement bets.
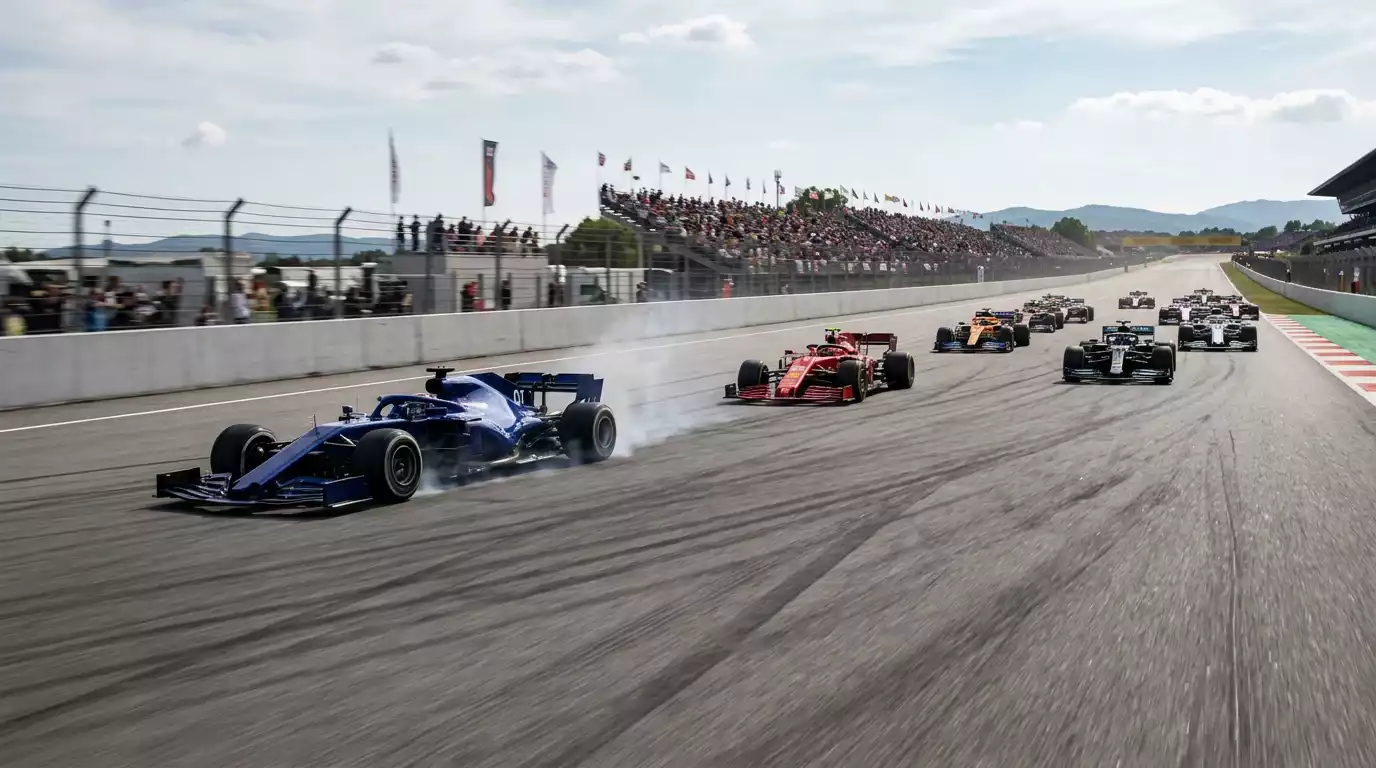
First-lap retirement probability also varies by circuit geometry. Tracks where the grid feeds into a tight first corner with limited run-off. Monza, Hungary, Spain, produce first-lap incidents at roughly double the rate of tracks with wide, sweeping first corners like Silverstone or Austin. A “first retirement on lap one” prop bet at Monza carries fundamentally different probability than the same bet at Silverstone, and I have found that bookmakers do not always adjust the pricing to reflect this difference.
First-Retirement Market Strategy
My approach to first-retirement markets starts with grid position analysis. Drivers starting between P10 and P16 face the highest first-lap incident risk because they are deep in the midfield pack where visibility is poor, car proximity is tight, and the drivers around them are more aggressive about gaining positions at the start. Drivers on the front two rows face almost zero first-lap contact risk because they have clear track ahead.
Within the P10-P16 band, I look for drivers with a history of poor race starts, identifiable through position-gained/lost data from the first lap across the current season. A driver who has lost an average of 1.5 positions on lap one across ten races is significantly more likely to be involved in a first-lap incident than one who gains positions consistently. The mechanical component sits on top of this: if that same poor-starter is running a high-mileage power unit, their first-retirement probability compounds from both incident and mechanical sources.
The 2026 regulations introduced heavier cars with different weight distribution, and the early-season races produced notably more first-lap incidents as drivers adapted to changed braking points and reduced visibility from the new bodywork regulations. This transition period creates a temporary spike in first-retirement value that should normalise by mid-season as the field adjusts. Betting the first-retirement market more aggressively in the opening five races of a regulation change year has produced positive returns in every recent regulatory reset.
Total Retirements and the Over/Under Line
The over/under line for total race retirements is one of the most mechanically priceable markets in F1. The historical average over the last five complete seasons sits at 2.1 retirements per race, with a standard deviation of 1.3. A line set at 2.5 retirements, the most common setting, implies the bookmaker expects roughly a 45% chance of three or more retirements. My own modelling, adjusted for circuit type and current reliability trends, agrees with this pricing in about 70% of races and finds value on 30%.
The value typically sits on the under at permanent circuits with long straights and generous run-off (Spa, Silverstone, Barcelona), where the combination of lower mechanical stress and fewer first-lap incident opportunities suppresses the retirement count. The value sits on the over at street circuits, high-altitude races, and any race where the weather forecast includes rain at any point during the race distance, because wet conditions increase both incident and mechanical retirement rates.
The Gambling Commission’s data showing 37.4 million active UK online gambling accounts includes a growing segment of punters drawn to binary-outcome markets like over/under, where the proposition is simple even if the analysis behind it is not. Retirement over/under is the ideal market for this cohort, easy to understand, settable from the sofa while watching the race, and analytically rich enough to reward serious research.
Integrating Retirement Risk into Your Other F1 Bets
Even if you never place a single direct retirement bet, understanding retirement probability improves every other bet you make. A podium bet on the fourth-fastest driver implicitly depends on at least one of the three faster drivers retiring or making a strategic error. Quantifying that conditional probability, rather than hoping for it vaguely, sharpens your podium pricing and identifies when the implied odds genuinely compensate for the conditional requirement.
I apply a simple overlay: before placing any podium or top-six bet, I estimate the probability that the drivers currently faster than my selection will all finish the race. If three drivers are clearly faster and each has a 92% race completion probability, the chance all three finish is 0.92 cubed, or 77.9%. That means there is a 22.1% chance that at least one retires, opening a slot for my driver. That 22.1% feeds directly into the podium probability calculation and often reveals value that a surface-level analysis of pace data would miss entirely.
Retirement probability is the hidden variable in almost every F1 betting market. Ignoring it means accepting the market’s implicit assumption that every car finishes every race, which demonstrably does not happen. Pricing it explicitly turns a background risk into an analytical advantage that compounds across every bet you place throughout a twenty-four-race season.
What is the average number of retirements per F1 race?
Over the last five complete seasons, the average sits at roughly 2.1 retirements per race. Street circuits average higher at about 2.4, while permanent circuits average lower at approximately 1.7. These figures include both mechanical failures and incident-related retirements.
How does power unit mileage affect retirement probability in F1?
As a power unit accumulates mileage beyond approximately 5,000 kilometres of race running, the mechanical retirement probability increases by an estimated 2-3 percentage points per subsequent race. Teams running older components ahead of planned grid penalties carry elevated reliability risk that feeds into both retirement and race outcome markets.
Created by the ”f1 Betting Guide” editorial team.