F1 Value Betting: How to Spot Mispriced Odds and Calculate Edge

I lost money in my first three seasons of F1 betting. Not because I picked the wrong drivers – my win rate was actually respectable – but because I consistently backed selections at prices that did not compensate for the times I was wrong. The turning point came when I stopped asking «who will win?» and started asking «is this price too high or too low?» That shift from prediction to valuation is the entire foundation of value betting, and it transforms F1 from a guessing game into something closer to a systematic discipline.
F1 currently accounts for just 0.4% of the global betting handle, per Jonny Haworth, F1’s Director of Commercial Partnerships – a figure he himself called «pretty crazy for a sport the size of Formula One.» That tiny market share has a direct consequence for value bettors: F1 odds receive less scrutiny from professional bettors and syndicate money than football or horse racing markets, which means pricing inefficiencies survive longer. The edge is there. You just need a framework to find it.
What Value Means in F1 Betting
Strip away all the jargon and value betting reduces to one question: does this price imply a probability lower than the actual probability of the outcome? If a bookmaker offers 5.00 (4/1) on a driver, they are implying a 20% chance of that driver winning. If your own analysis puts the true probability at 25%, the bet has positive expected value. You do not need to be right every time – you need the odds to overpay often enough to overcome the times you lose.
This is conceptually identical to how professional poker players think about hands. They do not bet because they know they will win; they bet because the pot odds compensate for the risk. F1 value betting works the same way, except the «pot odds» are set by the bookmaker rather than by other players at the table.
The practical challenge is estimating the true probability. In F1, that estimation draws on qualifying pace, long-run data from practice, historical track performance, tyre degradation rates, weather forecasts and team development trajectories. Nobody gets this estimate perfectly right. The goal is to be consistently less wrong than the bookmaker’s implied probability – and in a market that represents 0.4% of global volume, the bar is lower than in more heavily traded sports.
The Implied Probability Formula
Every F1 odds format – fractional, decimal, American – encodes the same underlying number: implied probability. Converting odds to implied probability is the first mechanical step in identifying value. The correlation between market-implied probabilities and actual bookmaker pricing in F1 sits at 0.95 over the past two seasons, per Sparkco.ai research. That tight correlation means the market is sharp but not perfectly efficient – the 5% gap is where value hides.
For decimal odds, the conversion is simple division. Implied probability equals 1 divided by the decimal odds. A driver priced at 4.00 has an implied probability of 0.25, or 25%. A driver at 11.00 has an implied probability of 9.1%. The sum of all implied probabilities in a market exceeds 100% – the excess is the bookmaker’s overround, which is their built-in margin.
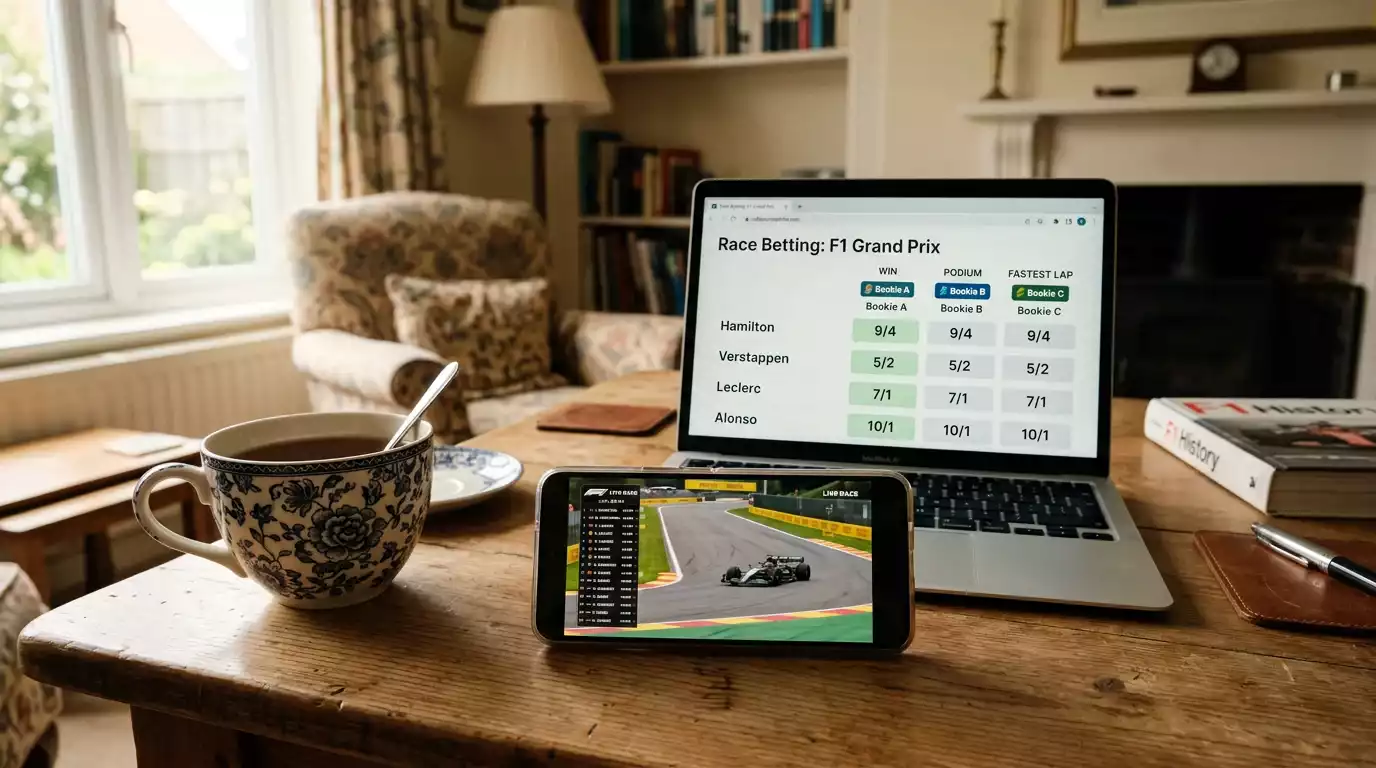
For fractional odds, the UK standard, the formula is: denominator divided by (numerator plus denominator). A driver at 7/2 has an implied probability of 2 divided by (7 plus 2), which is 2/9, or 22.2%. A driver at 14/1 has an implied probability of 1 divided by 15, or 6.7%.
The overround matters because it inflates every price in the market. A typical F1 race winner market carries an overround of 115-125%, meaning the sum of all implied probabilities across all 20 drivers totals 115-125% rather than the theoretical 100%. To find the «true» implied probability for any driver, divide their individual implied probability by the total market percentage. This adjustment is small but meaningful when you are trying to identify edges of 2-3 percentage points.
Expected Value: A Step-by-Step Calculation
Expected value. EV, is the number that tells you whether a bet is worth making. Positive EV means the bet makes money over time. Negative EV means it does not. Every bet I place goes through this calculation before I commit real money.
The formula: EV equals (probability of winning times net profit if you win) minus (probability of losing times stake lost if you lose). For a 10-pound bet at decimal odds of 5.00, with your estimated true probability of 25%: EV = (0.25 times 40) minus (0.75 times 10) = 10 minus 7.50 = +2.50. That positive 2.50 means the bet returns 2.50 pounds of expected profit per placement over a large sample.
Now change the probability estimate to 18%, below the implied 20%, and the calculation flips. EV = (0.18 times 40) minus (0.82 times 10) = 7.20 minus 8.20 = -1.00. The bet is negative EV. Even though 5.00 «looks like a decent price,» the maths say otherwise. This distinction between gut feeling and calculated expectation is the entire difference between recreational and strategic betting.
I run EV calculations on a spreadsheet that auto-populates with current odds from three or four operators. The spreadsheet highlights any selection where my probability estimate exceeds the adjusted implied probability (after removing overround) by at least 3 percentage points. Below that threshold, the edge is too thin to overcome variance and vig. Above it, I have a candidate for a real bet.
Where to Find Value in F1 Markets
F1’s tiny betting market share creates value through neglect. Football odds are hammered by thousands of sharp bettors within minutes of publication. F1 odds, by contrast, can sit undervalued for hours, sometimes all the way through qualifying and into race morning, because the market simply does not attract enough volume to correct pricing errors quickly.
Early-season races under new regulations are the richest environment for value. When the competitive order is uncertain, as it will be under the 2026 rules, bookmakers rely more heavily on prior-season data and public perception. If your own assessment of a team’s new-regulation potential differs from the market consensus, the gap between your estimated probability and the implied probability can be substantial.
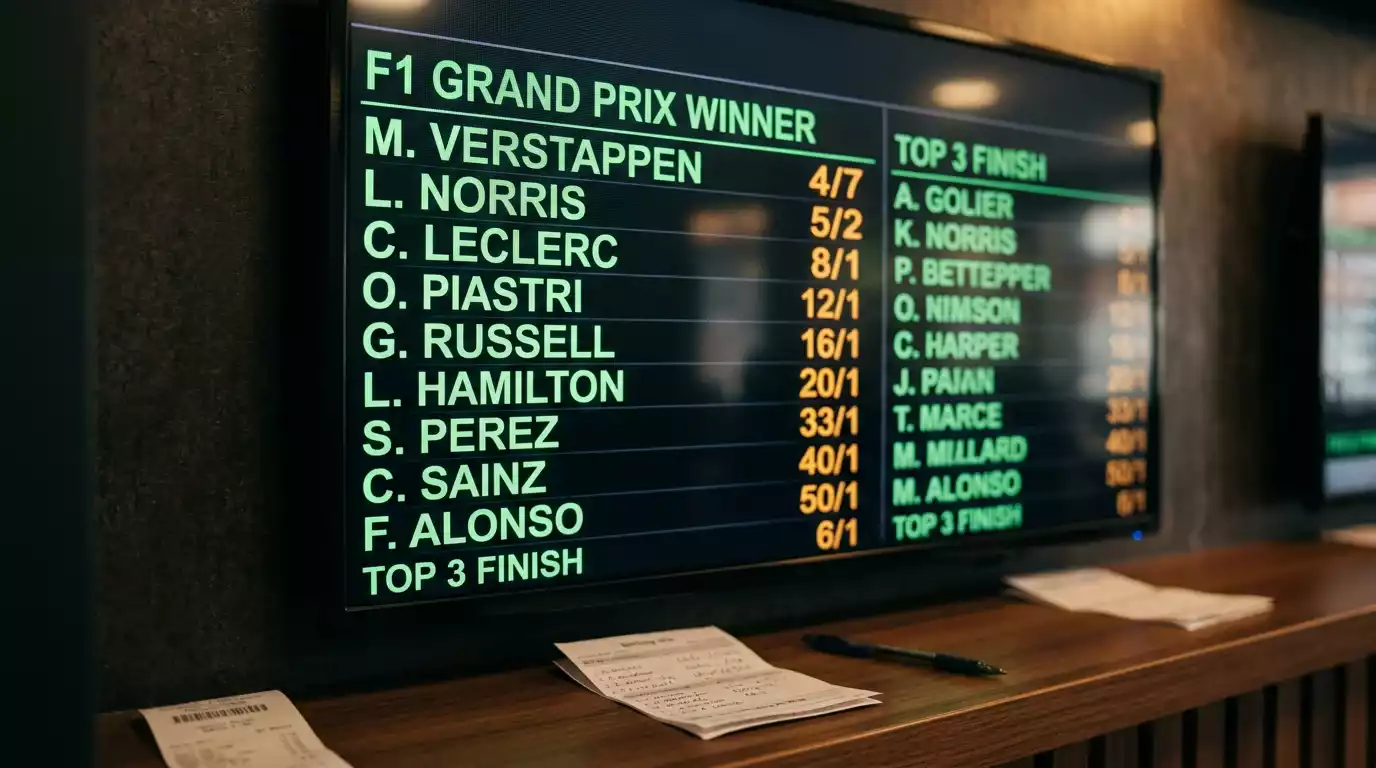
Midfield markets carry more value than front-runner markets. The top three or four drivers attract the most public attention and wagering volume, which means their odds are the most heavily scrutinised and efficiently priced. Drivers priced between 10/1 and 40/1 receive less analytical attention from both operators and the betting public. This is where misalignments between price and true probability are most common and most persistent.
Practice session data creates a time-limited value window. Long-run pace from FP2, tyre degradation curves and fuel-corrected lap times are available to anyone who watches the sessions, but most casual bettors do not process this data before the odds adjust. If you can analyse practice data within an hour of the session ending and identify a driver whose race pace exceeds what the current odds imply, you have a window before the market catches up. The full F1 betting strategy guide covers how to build this analysis into a systematic pre-race process.
One discipline I enforce rigidly: I never place a bet without a written probability estimate. If I cannot articulate why I think a driver has a 15% chance rather than the implied 10%, I do not bet. The act of writing down the reasoning forces me to identify whether I have genuine insight or whether I am rationalising a hunch. Over nine years, that single habit has protected me from more losing bets than any formula or model.
Can you consistently find value in F1 betting?
Consistent value requires a systematic approach, probability estimation, expected value calculation and disciplined staking. F1’s relatively small betting market means pricing inefficiencies persist longer than in football or horse racing, which creates genuine opportunities for bettors willing to do the analytical work. Consistency comes from the process, not from any individual bet.
Does F1’s small betting market create more mispriced odds?
F1 represents just 0.4% of the global betting handle, meaning its odds attract far less professional scrutiny than mainstream sports. Lower liquidity means pricing corrections happen more slowly, and misalignments between implied probability and actual probability survive longer, particularly in midfield markets and early-season races where uncertainty is highest.
Escrito por los editores de «f1 Betting Guide».