F1 Team Performance Trends: Reading Development Curves for Smarter Bets
 Available in US
Table of Contents
McLaren started the 2023 season as a lower-midfield team. By the summer break they were fighting for podiums. By Singapore they were winning races. Anyone who spotted that development curve early and adjusted their betting positions accordingly made more money from one team’s trajectory than most punters make from an entire season of race-by-race picks. Team performance trends are the single most underused data source in F1 betting, and I have built a significant chunk of my edge around tracking them. See also: f1 betting guide for all our data-driven F1 insights.
Why Team Development Matters More Than Driver Talent for Betting
F1 is a constructor’s sport dressed up as a driver’s championship. The car accounts for roughly 80% of lap time performance, and the remaining 20% is driver input. That ratio has held steady for decades, yet most punters still anchor their bets on which driver they believe is fastest rather than which team is developing fastest. The distinction is critical because driver talent is relatively stable across a season – Hamilton does not suddenly become two tenths quicker in July – but car performance shifts constantly as teams introduce upgrades, change setups, and respond to regulatory technical directives.
Tracking the gap between a team’s average qualifying position in the first five races versus races six through ten reveals development direction more reliably than any individual result. A team that qualifies P7 on average in the first block and P5 on average in the second block is gaining roughly 0.3 seconds per lap of pure car pace. That improvement compounds through the season, and the betting market consistently lags behind the trend because odds are anchored to recent results rather than projected trajectories.
F1’s revenue structure reinforces this dynamic. Formula One Group’s trailing twelve-month revenue reached 4.48 billion dollars by early 2026, and that commercial engine distributes prize money based on constructor standings, giving every team a financial incentive to push development relentlessly. The cost cap constrains spending but does not eliminate the variation in how efficiently teams convert budget into lap time, and that efficiency gap is what creates the performance trends bettors can exploit.
Reading Upgrade Packages Before the Market Does
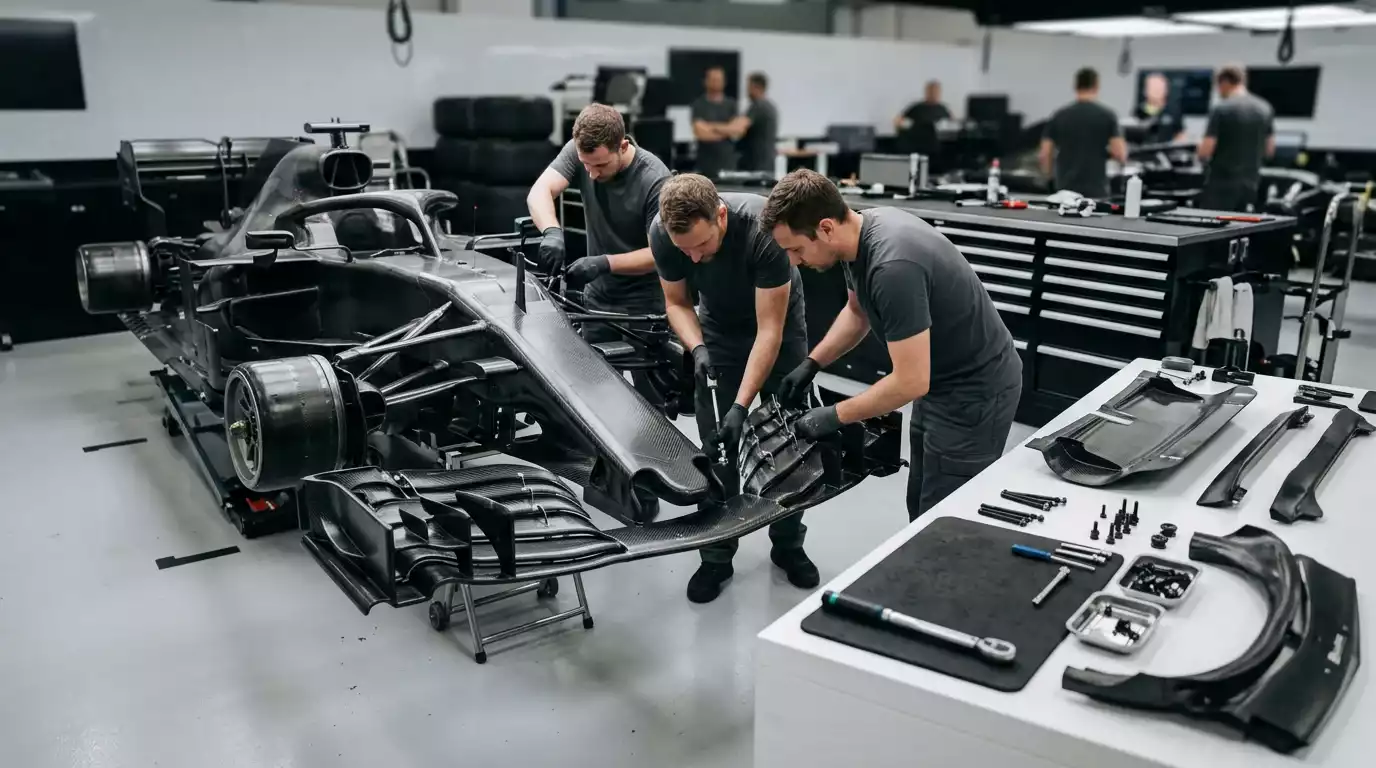
Every team brings upgrade packages to specific races, and the timing follows predictable patterns. European races clustered between May and September attract the largest upgrades because the logistics of shipping new parts to nearby circuits is simpler and cheaper. Barcelona, Silverstone, and Budapest are traditional upgrade races, and the performance data from practice sessions at these events often shows step changes in lap time that reshape the rest of the season.
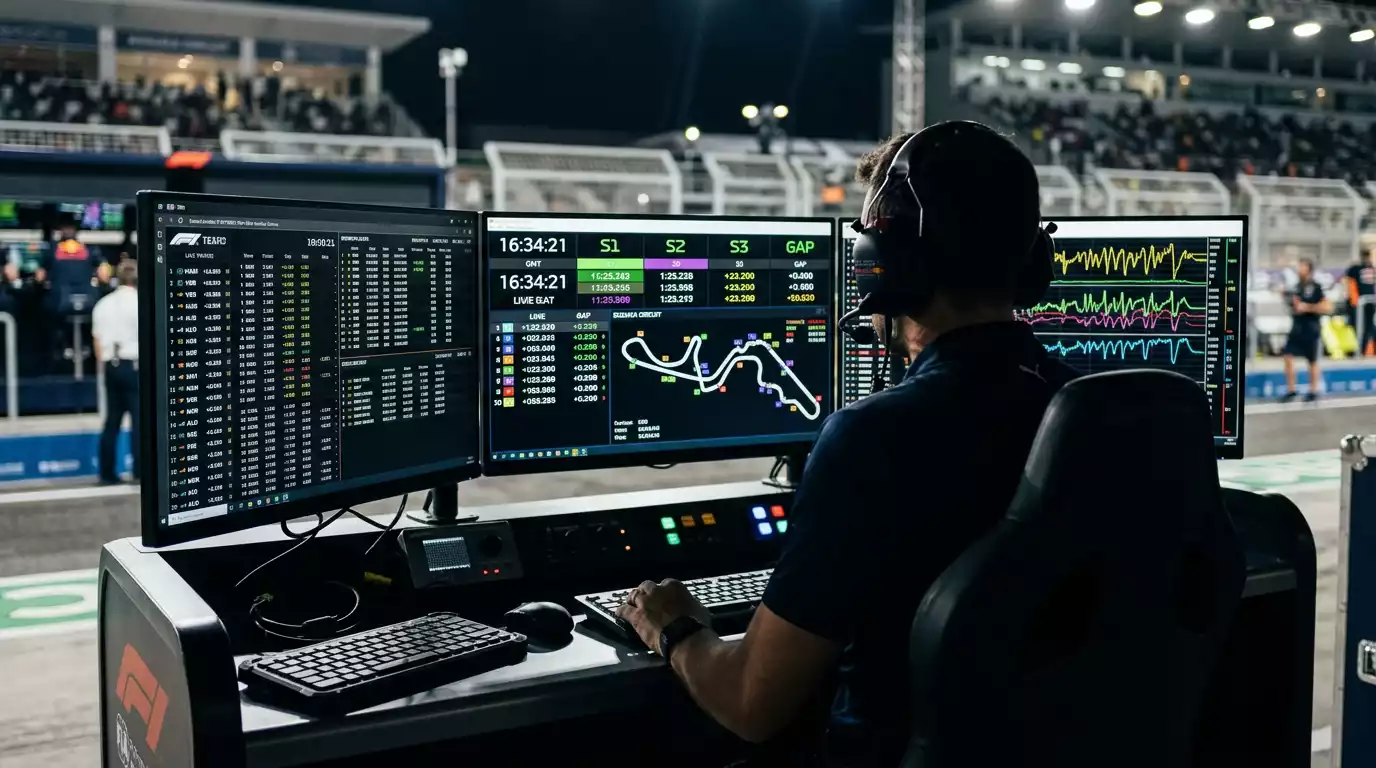
I monitor three sources to anticipate upgrades before they hit the track: team factory social media accounts, which occasionally reveal wind tunnel model images; pre-race scrutineering reports published by the FIA, which list new components; and the gap between a team’s practice pace and their recent race pace, which narrows when a meaningful upgrade arrives. A team that has been 0.6 seconds off the pace and suddenly runs 0.3 off in FP1 at Barcelona has likely introduced something significant, and the market needs several sessions to absorb that information.
The window between upgrade introduction and market adjustment is where the value lives. Outright race winner odds reprice after qualifying, but podium, points finish, and head-to-head markets often take an entire race weekend to fully absorb the new performance picture. Placing bets on Thursday or Friday morning – before practice data is available to the wider market – carries risk, but it also captures the largest edge when your upgrade intelligence proves correct.
Mapping Circuit Suitability to Team Characteristics
Not every upgrade improves a team equally at every circuit. A low-drag aerodynamic package that gains three tenths at Monza might cost a tenth at Monaco. Understanding how each team’s car characteristics interact with circuit demands is what separates a blanket trend assessment from a granular, race-by-race edge.
I categorise the calendar into four circuit types for trend analysis: high-speed power circuits (Monza, Spa, Jeddah), medium-speed balanced circuits (Silverstone, Barcelona, Suzuka), low-speed street circuits (Monaco, Singapore, Baku), and high-altitude circuits (Mexico City, Interlagos in some conditions). Each team’s performance trend behaves differently across these categories. A team with a strong power unit gains more at power circuits but treads water at street circuits, and that asymmetry creates pricing opportunities because the market often applies a single performance trend across all circuit types.
The 2026 regulations introduced a 50% electrical power contribution from the power unit, fundamentally reshaping which teams are strongest at which circuit types. This reset widened the performance variation between circuit categories for most teams, and the early-season data is still too thin for bookmakers to price circuit-specific trends accurately. That pricing uncertainty is a feature, not a bug, for punters who build their own circuit-suitability models.
Teammate Performance Gaps as a Team Health Indicator
When both drivers in a team perform at similar levels, the car is likely in a stable development window and the team’s operational execution is clean. When one driver significantly outperforms the other, something is wrong – either the car has a setup sensitivity that one driver manages better, or the team is prioritising one side of the garage over the other. Both scenarios produce betting signals.
A widening teammate gap mid-season often precedes a team’s performance plateau. If the car becomes harder to drive – a common side effect of aggressive aerodynamic development – the less experienced or less adaptable driver suffers first, and their results deteriorate before the team’s overall trajectory shifts downward. Watching the junior driver’s qualifying deficit grow from two tenths to five tenths over three races is an early warning that the team’s upgrade path may have hit diminishing returns.
The Sparkco.ai analysis found a 0.95 correlation between market implied probabilities and actual bookmaker odds across recent seasons, but that correlation weakens at the individual team level when internal dynamics shift. A team in flux – new technical director, driver contract disputes, internal political tension – produces results that deviate from their pure car performance, and the market’s inability to model these soft factors creates value for punters who track the paddock narrative as closely as the lap time data.
Seasonal Rhythm and When Teams Peak
Teams do not develop linearly. Most follow a pattern of rapid early improvement, a mid-season plateau while the wind tunnel focuses on next year’s car, and a late-season push if they are in a championship fight or trying to secure a higher constructor position for prize money purposes. Knowing where each team sits in this cycle determines whether their current form is sustainable or about to regress.
The summer shutdown – a mandatory factory closure period – disrupts development momentum for every team, but it affects smaller teams more than larger ones. Larger teams complete their post-shutdown upgrades faster because their simulation and manufacturing infrastructure handles the compressed timeline more efficiently. The two races immediately after the shutdown often produce the sharpest performance shifts of the entire season, and the betting market is slowest to adjust at precisely this moment because there is no recent data to anchor the new prices.
Late-season development decisions create one of my favourite annual betting angles. By September, teams fighting for third through sixth in the constructors championship must decide whether to keep developing the current car or redirect resources to next year. Those that keep pushing tend to overperform their summer form in the final quarter of the season, while those that switch focus early plateau or decline. The constructor standings heading into the summer break, combined with team principal interviews about development priorities, give strong signals about which path each team will take.
Applying Trend Data to Your Betting Week
My workflow each race week starts with updating the team performance tracker – a spreadsheet that records each team’s qualifying gap to pole and race pace gap to the winner at every circuit, indexed by circuit type. Before practice begins, I pull up the historical data for that circuit type and overlay the current season trend to generate an expected qualifying and race performance range for each team.
This expected range becomes the benchmark against which I evaluate the odds. If my model expects a team’s lead driver to qualify between P4 and P6, and the bookmaker prices them at 8/1 for a podium, I compare the podium probability from that qualifying range against the implied probability of 8/1. When my estimate exceeds the implied probability by at least 10%, I have a potential bet. When it does not, I pass.
The discipline is in the passing. Most races produce no value from trend data alone because the market is efficient enough on average. But three to five races per season produce clear trend-based edges – typically at upgrade races, immediately post-shutdown, and at the first race on a new circuit type after a major regulatory change. Those three to five bets, properly sized and consistently executed, have contributed more to my season-long P&L than the thirty-plus race-by-race picks I make on gut instinct and short-term form. See also: use these trends to sharpen your F1 betting odds analysis.
How do I track F1 team performance trends for betting?
Record each team’s average qualifying deficit to pole position and race pace gap to the winner at every race, categorised by circuit type. Compare these figures across five-race rolling blocks to identify whether a team is improving, plateauing, or declining relative to the field.
When do F1 teams typically introduce their biggest upgrades?
Major upgrade packages cluster around European races between May and September, with Barcelona, Silverstone, and Budapest as traditional upgrade circuits. The first race after the summer shutdown also frequently features significant new components as teams bring work completed during the factory closure.
Written by the editors at f1 Betting Guide.